Git to Know You · Part 2
#2. Git to Know You: New Relic
Published June 24, 2025 · Updated August 8, 2026
Alright, now that we have started reducing TOIL, we need visibility.
You can automate all day, but when a customer says, “the application is slow,” you still need to answer a much harder question:
What is actually happening?
That is why New Relic is still one of my favorite tools in the reliability toolbox.
Observability is the difference between guessing and investigating. New Relic brings application performance, infrastructure signals, logs, traces, browser/user experience, synthetics, dashboards, and alerting into one platform so you can start connecting symptoms to causes.
You do not need to be a senior engineer to get value from that. A beginner can learn a lot by watching what normal traffic looks like, what changes during a failure, and how several signals line up around the same incident.
Monitoring vs. observability
Monitoring asks whether the things you already know to watch are healthy.
Observability helps you investigate questions you did not know you would need to ask.
A ping check telling you a site is unavailable is monitoring. Looking at application transactions, infrastructure metrics, logs, distributed traces, and recent changes to understand why it is unavailable is closer to observability.
New Relic supports both.
Why New Relic?
New Relic can ingest and connect telemetry from applications, infrastructure, cloud services, logs, browser sessions, synthetic checks, Kubernetes, and a large integration ecosystem.
For an SRE or operations team, the real value is context.
A useful dashboard might tell you:
- which customers or services are affected;
- when the behavior began;
- whether CPU, memory, storage, or network conditions changed;
- whether a deployment happened nearby;
- which transaction or dependency is slow;
- whether the problem is global or isolated;
- whether the user experience matches what the infrastructure metrics suggest.
That is much more useful than a red light that only says “bad.”
A Real Story: Turning Customer Complaints Into Evidence
We used to receive customer reports that their applications were slow or unavailable, but the reports alone did not give us enough information to understand the pattern.
After adding monitors and dashboards in New Relic, we started correlating the failures. Multiple applications were using a shared FSx storage layer. Scheduled Windows maintenance on that storage could cause brief disconnects, and those windows lined up with the customer-facing problems we were seeing.
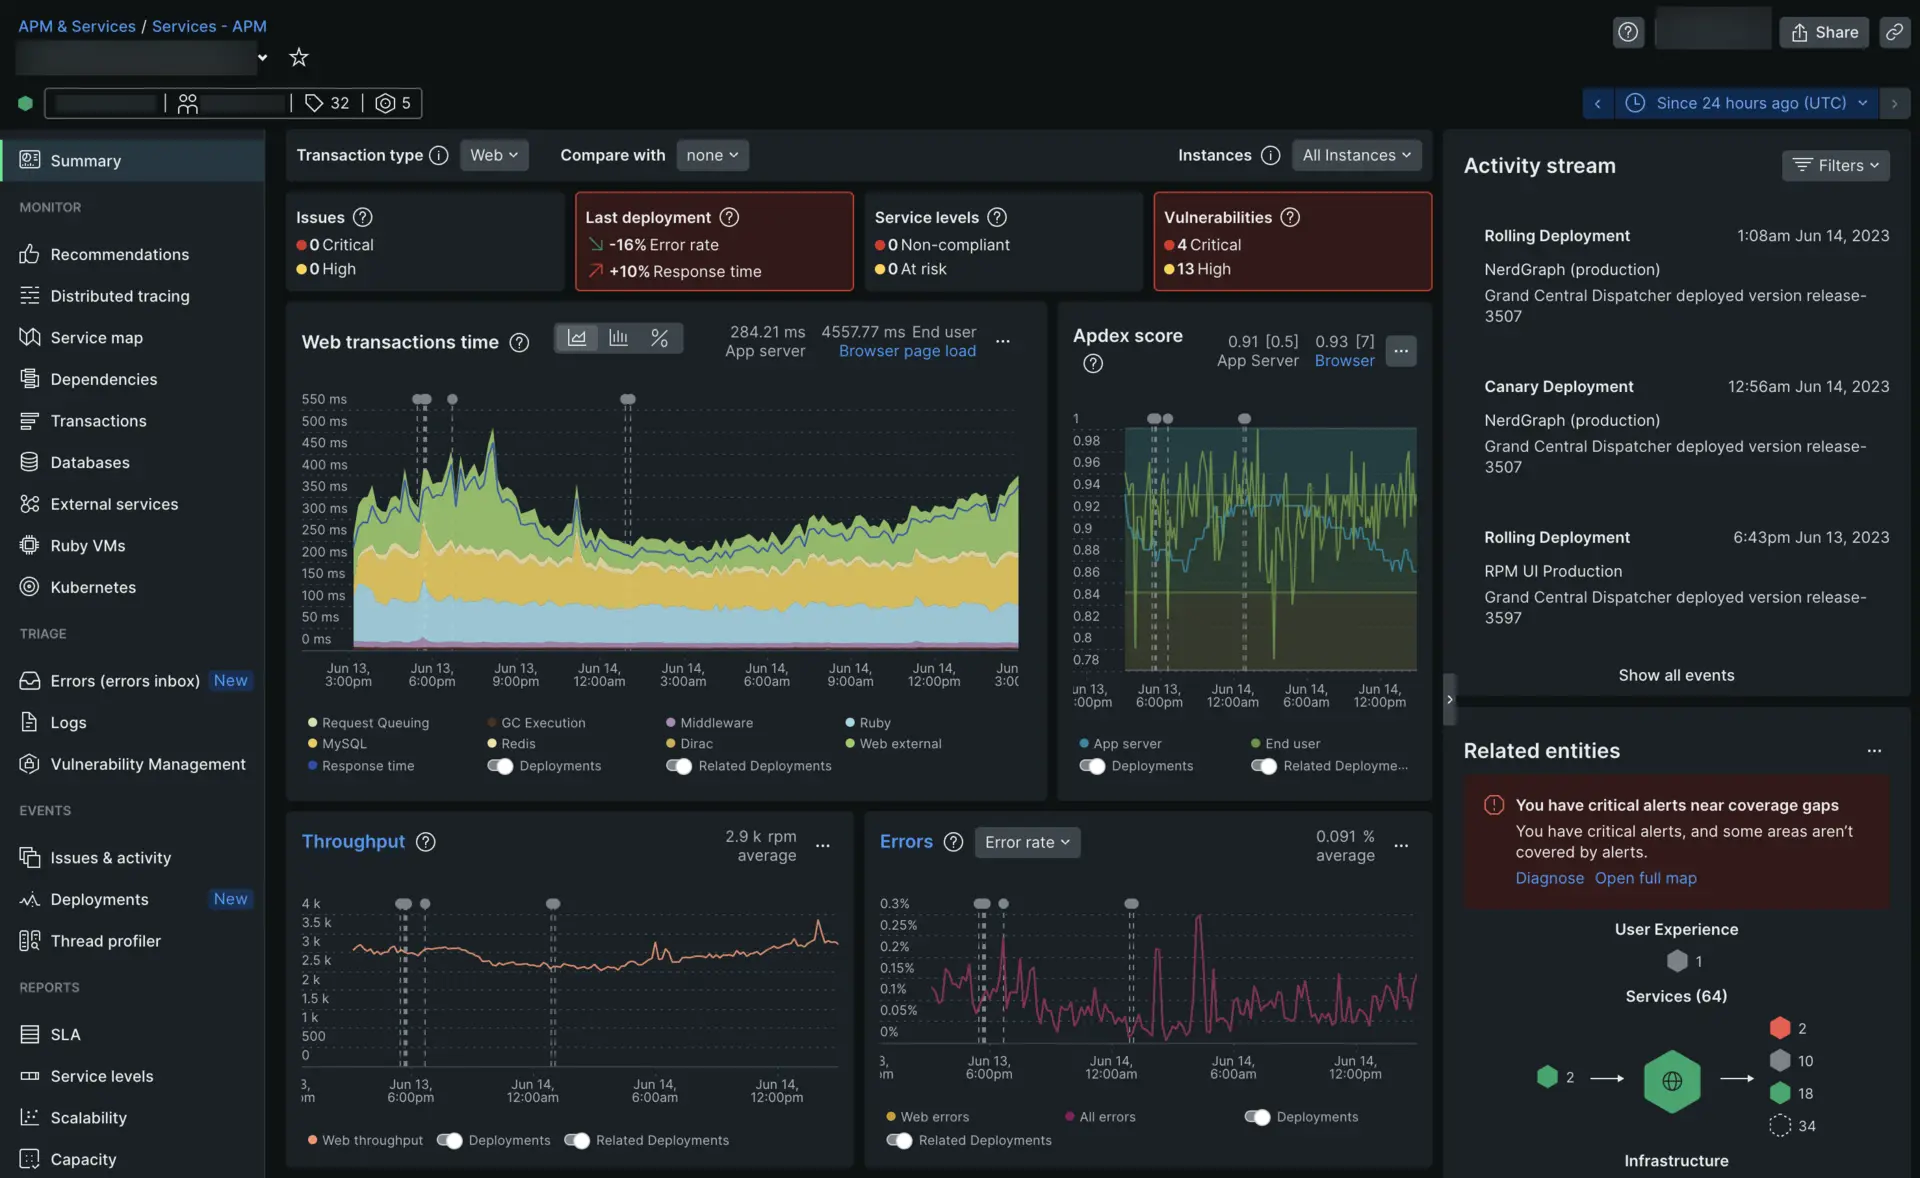
Once we had evidence instead of anecdotes, we could change the operating response. We adjusted maintenance schedules, improved alerts, and built dashboards that support teams could use in real time.
The result was fewer avoidable escalations and faster troubleshooting. More importantly, support and engineering were looking at the same evidence instead of arguing from different guesses.
That is the part of observability I care about most: shared facts change the quality of the conversation.
Dashboards should answer a question
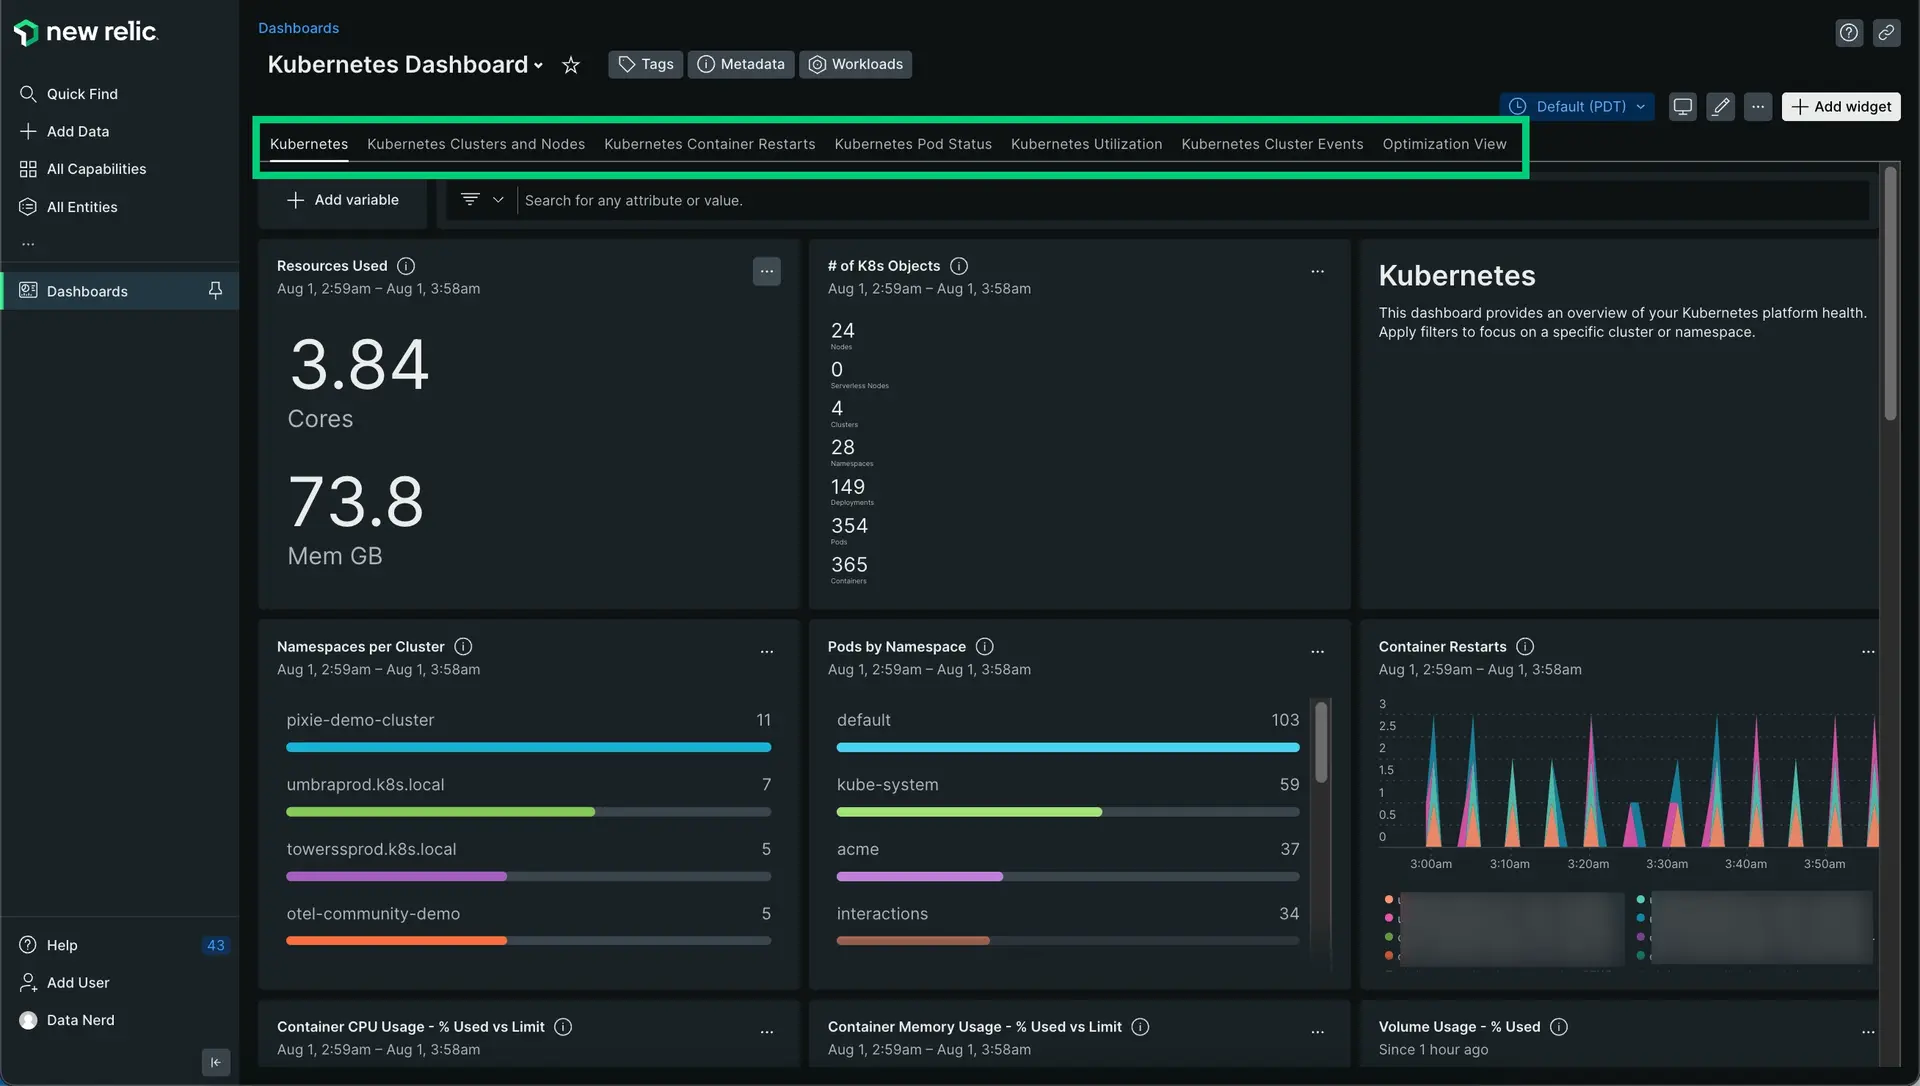
It is easy to build a beautiful dashboard with forty charts that nobody actually uses.
I would rather have a smaller dashboard that answers questions such as:
- Are customers impacted right now?
- Which service is unhealthy?
- Is this behavior outside the normal baseline?
- What changed around the time the incident started?
- Which dependency should I inspect next?
A dashboard is useful when it helps someone make a decision.
Useful New Relic capabilities for beginners
Application Performance Monitoring
APM helps you understand application transactions, response times, errors, and dependencies rather than looking only at host health.
Logs, metrics, and traces
These signals are much more powerful when you can correlate them instead of treating each tool as a separate island.
Infrastructure monitoring
Hosts, containers, Kubernetes, and cloud integrations give application behavior the infrastructure context around it.
Synthetics
Synthetic checks let you test availability or user flows from outside the application instead of waiting for a real user to discover the failure first.
Browser and digital experience monitoring
Infrastructure can look healthy while the user experience is terrible. Front-end telemetry helps close that gap.
Alerts
Good alerting should identify conditions that require action. Bad alerting simply converts every interesting metric into another notification.
Where New Relic can get difficult
- The platform is broad. Beginners can get lost if they try to learn every capability at once.
- Telemetry volume matters. Sending everything forever is not a strategy; instrument intentionally and understand what you ingest.
- Dashboards require design. Default views help, but the best operational dashboards usually reflect your own services and failure modes.
- Alert noise is still your responsibility. A powerful alerting system can create powerful alert fatigue.
- Pricing depends on usage and access. Observability costs deserve active ownership as environments grow.
Current free tier
As of this 2026 refresh, New Relic’s official free offering includes 100 GB of data ingest per month, unlimited basic users, and one full-platform user, along with default retention and access to the broader platform.
Those details can change, so check New Relic’s current pricing page before designing an environment around a specific limit.
For learning, though, the free tier is substantial enough to instrument a small application and start seeing how logs, metrics, traces, dashboards, and alerts connect.
Bottom Line
New Relic is valuable because it teaches you to replace “I think” with “the telemetry shows.”
Start with one application. Add a simple availability check. Learn its normal response time. Build one dashboard around a real operational question. Then create one alert you would genuinely want someone to wake you up for.
You do not need hundreds of charts to practice observability.
You need enough evidence to make the next decision with confidence.